 FAO Map Catalog
Geoscientific information
Type of resources
Available actions
Topics
Keywords
Contact for the resource
Provided by
Years
Formats
Representation types
Update frequencies
status
Scale
Resolution
-
The FGGD terrain slope map is a global raster datalayer with a resolution of 5 arc-minutes. Each pixel contains a terrain slope class value for the pixel area. The data are from U.S. Geological Survey, 1993, GTOPO 30, as reported in FAO and IIASA, 2000, Global agro-ecological zones, and FAO and IIASA, 2007, Mapping biophysical factors that influence agricultural production and rural vulnerability, by H. von Velthuizen et al.
-
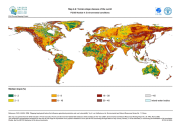
The FGGD soil constraints map is a global raster datalayer with a resolution of 5 arc-minutes. Each pixel contains a class value for the degree to which soil characteristics constrain agricultural production potential in the pixel area. The data are from FAO and IIASA, 2000, Global agro-ecological zones, as reported in FAO and IIASA, 2007, Mapping biophysical factors that influence agricultural production and rural vulnerability, by H. von Velthuizen et al.
-
Grid with estimated easily available soil moisture in mm/m with a spatial resolution of 5 * 5 arc minutes. Information with regard to easily available soil moisture was calculated from the "Derived Soil Properties" of the "Digital Soil Map of the World" which contains raster information on soil moisture in different classes.
-
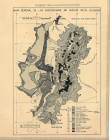
Include : Mapa de los grupos de suelos del Ecuador (Apendice 5) (Spanish) (1 000 000) Broad Soil Association of Ecuador (English) (1 000 000) (2 Sheets)
-
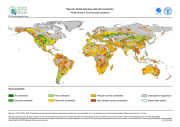
Simplified version of the FAO/UNESCO soil map of the world, containing only 8 major soil classes. The map has been used to do the back cover of the publication GIS in FAO (FAO, Feb 89)
-
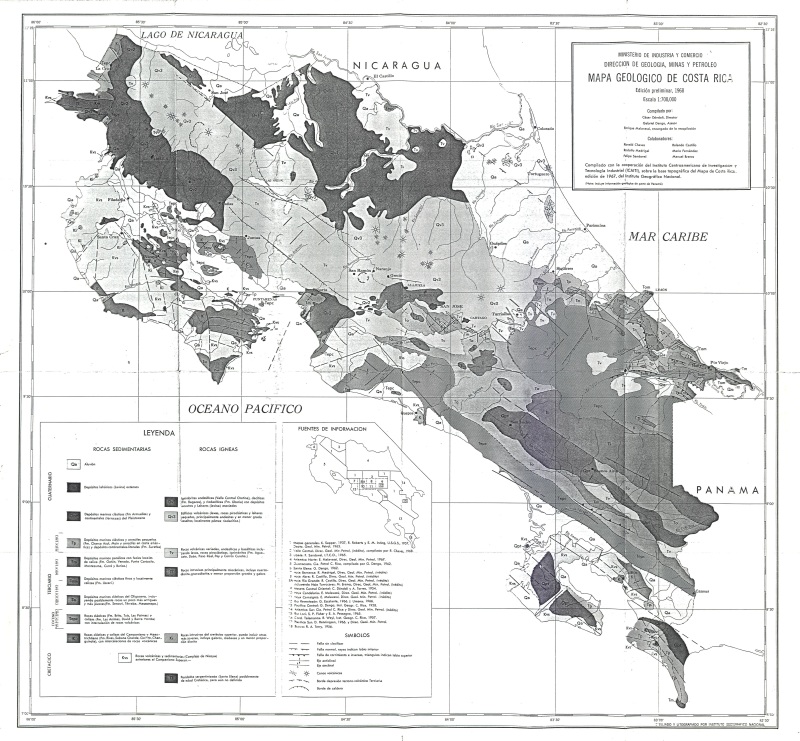
Mapa geologico de Costa Rica (Ed. Preliminar)
-
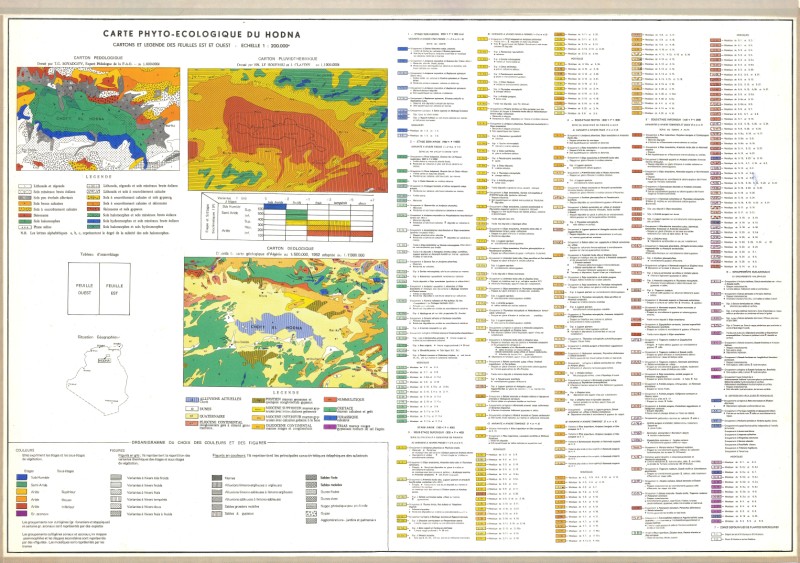
Include : Carte Phyto-Ecologique du Hodna (Cartons et legende des fuilles est et ouest) (200 000)
-
The digital soil map for North and Central Eurasia region (covering China, Taiwan Province of China, Mongolia, CIS and the Baltic States) was prepared by FAO and IIASA in co-operation with: ? the Institute of Soil Science, Academia Sinica (Li Jin, Zhou House in 1978) for China and Taiwan Province of China (scale 1:4 million). ? the Pocveni Institute, V. Stolbovoy and B. Sheremet (1994) for Mongolia (scale 1:2.5 million) The original soil maps from China, Mongolia and CIS_BS have been merged by introducing DCW boundaries between: China-CIS_BS; China-Mongolia; Mongolia-CIS_BS. The original soil map of China includes the Chinese line between India and China, which extends beyond the Indian line, and the South China Sea islands (no soil information is present for the South China Sea islands). Those boundaries do not imply the expression of any opinion whatsoever on the part of FAO concerning the legal or constitutional states of any country, territory, or sea area, or concerning delimitation of frontiers. For further information on related tables, texture etc. please read the readme.rtf and readme.xls documents available for downloading.
-
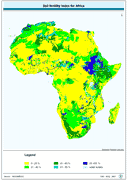
Soil fertility index for Africa derived from the FAO/UNESCO Digital Soil Map of the World interpreted in terms of soil fertility.
-
ASSOD (1997) is a follow-up activity of GLASOD. The same methodology was used at a more detailed scale (1:5M) for South and Southeast Asia. The GLASOD methodology was slightly refined. © ISRIC,FAO,UNEP, 1997